Featured Snippet
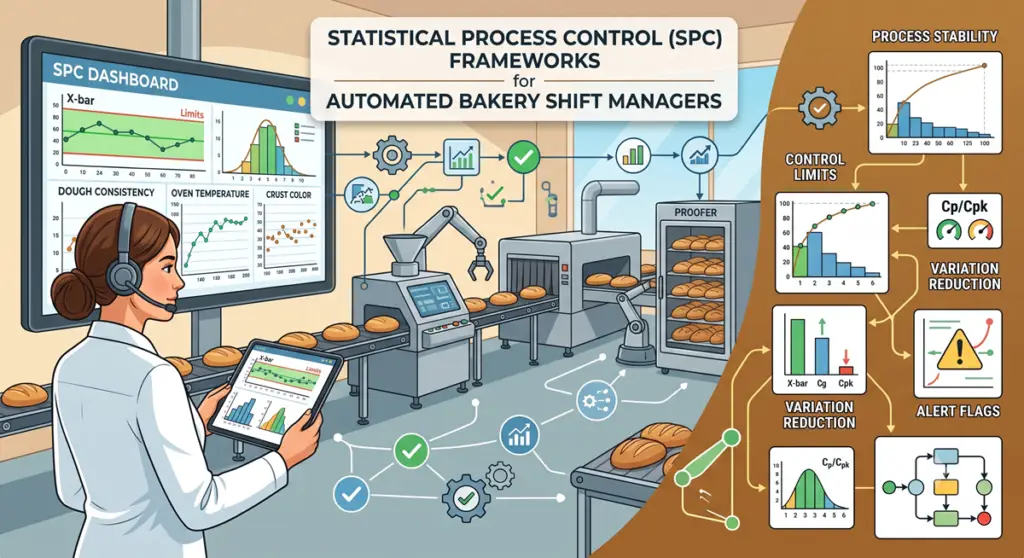
Implementing a Statistical Process Control (SPC) framework allows industrial bakery shift managers to distinguish between normal process variations and actionable equipment malfunctions. By plotting real-time weights, temperatures, and moisture metrics on standard control charts, operations can proactively stabilize line yield before products breach critical quality control limits.
Key Takeaways
- Real-Time Data Streams: Automated SPC frameworks convert erratic floor measurements into predictable, visual trends using upper and lower statistical control limits.
- Proactive Defect Prevention: Shift supervisors can catch structural calibration drifts early, thereby eliminating massive product giveaway cycles downstream.
- Data-Driven Staff Accountability: Consequently, floor operators rely on objective control chart violations rather than subjective guesswork to execute line adjustments.
In high-capacity manufacturing facilities, maintaining uniform product quality across a 12-hour shift is an ongoing operational battle. Small variations in ambient humidity, ingredient lots, or mechanical wear frequently combine to throw highly automated lines out of alignment. Specifically, relying on end-of-shift reports to catch these errors is a major mistake that guarantees high waste.
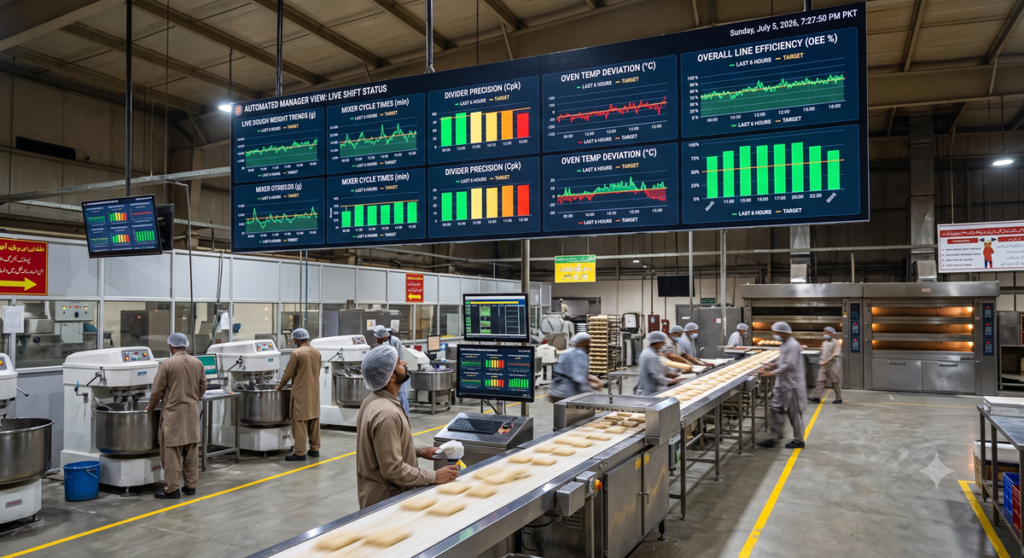
To lock in an immediate Micro-Win on your shift today, print out a simplified, manual X-bar chart and tape it directly to the volumetric divider console. This physical visual aid empowers your operators to log and track weights manually every 20 minutes, forcing immediate visibility onto the production floor.
Contextual Overview of the Problem
Automated bakery lines move too quickly for traditional, reactive quality checks. If a quality control team only measures finished product dimensions at the packaging station, hundreds of kilograms of out-of-spec dough have already moved through the proofer and oven. Therefore, plants need a live, statistical framework that monitors variables at the exact point of processing.
The core challenge stems from the fact that all food production processes exhibit natural, inherent variation—known as common-cause variation. For example, slight movements in dough density due to yeast activity are normal.
However, when a mechanical component fails, such as a slipping conveyor belt or a drifting temperature probe, it introduces assignable-cause variation. Without an active SPC framework on the floor, shift managers cannot accurately distinguish between these two states. Consequently, operators often over-adjust their machinery in response to normal variation, which inadvertently destabilizes the entire makeup line.
Systematic Steps to Fix Processing Variance
1. Identify Key Process Indicators (KPIs)
First, isolate the high-impact operational variables that directly dictate final yield stability. Specifically, you must focus on out-of-mixer dough temperature, raw volumetric divider piece-weight, and exit-cooler moisture percentages. Measuring too many variables simultaneously dilutes floor focus.
2. Establish Base Statistical Control Limits
Next, pull data from 30 consecutive, normal batch runs to calculate your plant baseline. Use these historical data points to establish your Upper Control Limit (UCL) and Lower Control Limit (LCL). Furthermore, ensure these statistical limits sit safely inside your absolute customer specification limits to provide a buffer zone.
3. Train Floor Operators on Control Chart Interpretation
Train your shift personnel to actively read live control charts rather than ignoring them until an alarm sounds. Specifically, teach operators to watch for standard warning signs, such as five consecutive data points trending steadily upward or downward toward a control limit. This pattern signals an active calibration drift that requires immediate attention.
4. Standardize the Corrective Action Plan (CAP)
Finally, create a clear, step-by-step troubleshooting protocol for every control limit breach. For example, if a piece-weight crosses the UCL line, the operator must execute a precise, predetermined mechanical adjustment rather than guessing. This structured approach removes human error and ensures repeatable corrections across all shifts.
What the Manual Doesn’t Tell You (The Technical Edge)
Standard SPC textbooks teach that data points on a control chart should always be completely independent. However, on an industrial bakery floor, automated data streams frequently suffer from process autocorrelation.
Specifically, because dough is processed in continuous, massive batches, the weight of one dough piece is highly dependent on the weight of the piece right before it. If a modern volumetric hopper develops an uneven core temperature, a large, dense pocket of dough will pass through the system over several minutes. This creates a dense, autocorrelated run of heavy pieces on your chart.
Consequently, standard statistical rules will flag this as an out-of-control malfunction, prompting an operator to alter the divider settings. Furthermore, as soon as the dense pocket clears, the newly adjusted machine will suddenly slice the normal dough far too light. Shift managers must account for this by instructing operators to verify a density shift across a full 10-minute window before altering automated mechanical parts.
Technical Specifications & Industry Benchmarks
To calculate the structural capability of your automated baking machinery, shift managers utilize the Process Capability Index (Cpk). This calculation measures how close your production line is running relative to your quality specification limits:
Cpk = Minimum [ (USL – Mean) / (3 × SD), (Mean – LSL) / (3 × SD) ]
Where:
- USL is the Upper Specification Limit allowed by quality control or the customer.
- LSL is the Lower Specification Limit allowed by quality control or the customer.
- Mean is the calculated mathematical average of your active floor sample measurements.
- SD (Standard Deviation) is the statistical measure of the dispersion or spread of your data points.
To comply with international manufacturing benchmarks, an efficient high-speed food production line must maintain a Cpk score of 1.33 or higher. Specifically, a score below 1.00 indicates that your process variation is too wide for your machinery setup, meaning the system is mathematically guaranteed to produce out-of-spec, wasted product.
Diagnostic Reference Table
| Symptom | Probable Cause | Technical Fix |
| Data points hugging the UCL or LCL without breaching them. | Systematic shift in raw material properties, such as a new flour lot with higher water absorption. | Recalibrate your automated mixer dosing weights to adjust the water-to-flour ratio back to baseline. |
| Sudden, extreme spikes outside both control limits. | Mechanical binding or electrical voltage fluctuations impacting the inline checkweigher load cells. | Stop the conveyor line immediately, clean the load-cell sensor plate, and execute a dynamic calibration check. |
| Cyclical wave patterns repeating on the chart every 30 minutes. | Temperature cycles in the proofer or automated cooling tunnels caused by faulty compressor cycling. | Service the HVAC electrical relays and adjust the thermostat differential window to less than 0.5°C. |
Critical Mistakes to Avoid on the Floor
- Conflating Control Limits with Spec Limits: Never mistake your statistical control limits for your customer specification limits. Control limits reflect what your machinery is actually doing; specification limits represent what you want it to do.
- Adjusting Controls on Single Data Points: Instructing operators to twist dials because a single piece of dough weighed in slightly high is a massive error. This practice, known as tampering, actively injects extra variation into the system.
- Using Manual Logs with Delayed Data: Allowing operators to write down hourly averages in a paper binder at the very end of their shift completely defeats the purpose of SPC. By the time the data is recorded, the bad product is already baked.
🔹 Internal Linking
- Yield Calculations: Review our operational guide on [Industrial Bakery Yield Loss Calculation] to better align your floor data streams.
- Weight Drift: Read about [Managing Rheological Weight Drift in Commercial Dough Hoppers] to counter density shifts before they alter your charts.
Conclusion
Moving from a reactive mindset to a proactive SPC framework is the single most effective way to eliminate processing waste on a high-speed line. By making variation visible, you put control back into the hands of your shift leaders. Need to bring your line parameters under tight control? [Contact our industrial manufacturing automation engineers today for a complete line monitoring setup] to permanently stabilize your shift metrics.
People Also Ask
For high-speed production running over 10,000 units per hour, a standard sample size of 5 consecutive pieces collected every 15 to 20 minutes offers excellent statistical sensitivity without overwhelming floor operators.
Yes, modern industrial data modules can collect analog signals from older PLC systems and convert them into digital outputs. This allows you to generate live control charts without upgrading your entire automated line machinery.
A high Cpk score of 1.33 or greater means your line variation is highly compressed around your target weight. Therefore, you can safely lower your target scaling weight closer to the legal minimum, saving thousands of kilograms of raw dough per year.